The original version of this article, Income and Wealth Per Person Worldwide, was written in 2012. It used a simple thought experiment: if the world's yearly production and accumulated wealth were divided evenly, what would the number look like for each person?
That is still a useful exercise, but it needs a little more care in 2026. GDP is not wages. Wealth is not income. A dollar in one country does not buy the same life that it buys in another. And the average can hide almost everything important, because a relatively small number of people can pull the average far away from the normal experience of most families.
The quick 2026 version
In the 2012 article, the rough estimate was about $70 trillion in world GDP and about 7 billion people, or around $10,000 per person per year. Using the latest World Bank data available in 2026, world GDP was about $111 trillion in 2024 and the world population was about 8.14 billion. That works out to about $13,631 in GDP per person.
The IMF's April 2026 World Economic Outlook projection puts world GDP for 2026 at about $126.3 trillion, or about $15,680 per person in nominal U.S. dollars. If measured by purchasing power parity, which tries to adjust for what money buys locally, the IMF's 2026 number is about $27,650 per person.
So one clear change since 2012 is that the world is producing much more. The simple global GDP-per-person number has moved from about $10,000 to somewhere in the $13,000 to $16,000 range in nominal dollars, depending on whether we use the latest completed World Bank year or the IMF's 2026 projection. By purchasing power, the number is considerably higher.
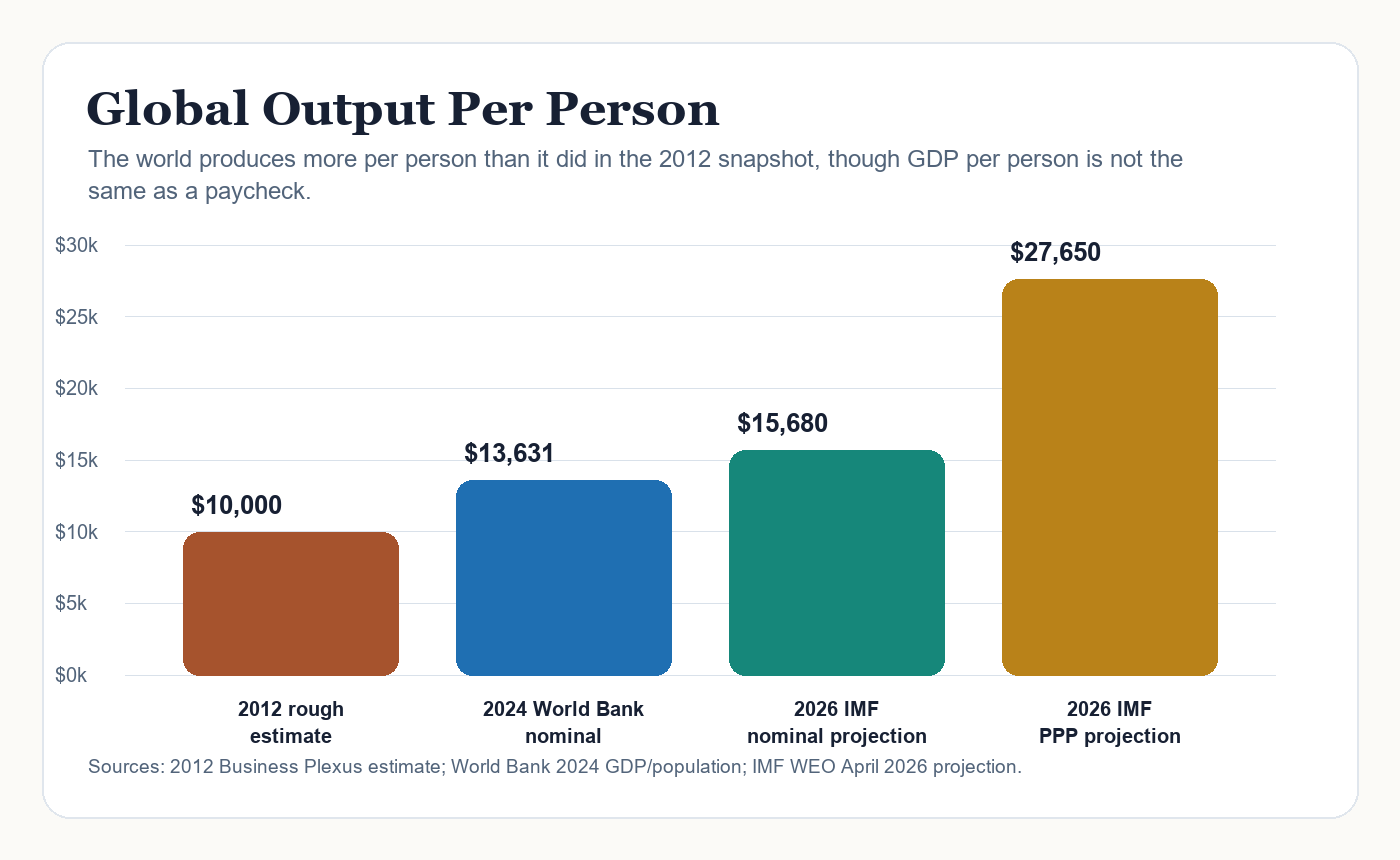
Global output per person has risen since the 2012 article, though GDP per person remains a production measure rather than a household income measure.
But income and wealth tell different stories
GDP per person is a measure of production. It is not a paycheck. It includes profits, depreciation, government activity, investment, and output that does not land evenly in household bank accounts. Still, it is useful because it gives us a ceiling on what the world economy is capable of producing in a year.
Wealth is the accumulated side of the ledger: homes, land, businesses, retirement accounts, stocks, bonds, cash, and debts subtracted from assets. UBS's Global Wealth Report 2025 shows how different the wealth picture is from the income picture. In its 2024 sample, the top wealth band of about 60 million adults with more than $1 million held about $226.47 trillion, or 48.1% of the sample's wealth. At the other end, about 1.57 billion adults with less than $10,000 held only about $2.71 trillion, or 0.6%.
If we add the UBS wealth bands together, the sample contains roughly $469.5 trillion in personal wealth. Divided across the adults in that sample, the arithmetic average is about $123,000 per adult. But that average is almost comically misleading if taken as the experience of a typical adult. A large share of adults have less than $10,000, while the millionaire group holds nearly half of the wealth.
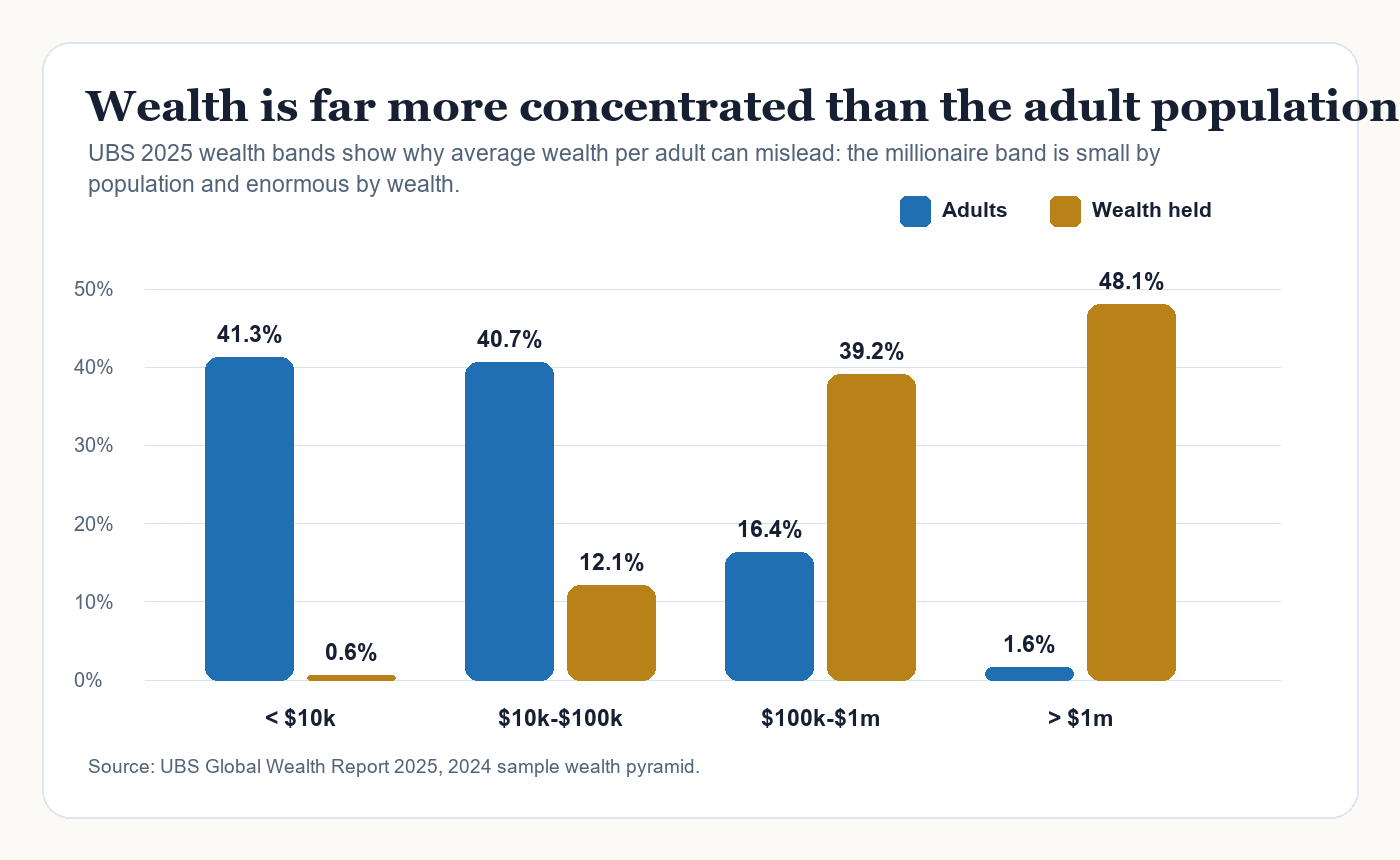
UBS wealth bands show the central problem with averages: the millionaire group is small by population but holds nearly half of sample wealth.
What changed since the 2012 snapshot?
The population is larger. The economy is larger. Financial assets are larger. Real estate values in many parts of the world are larger. The number of millionaires is also much larger. UBS estimates nearly 60 million U.S. dollar millionaires in its 2024 sample, with more than 680,000 added in 2024 alone.
The bottom of the global economy is not standing still either. Some countries that were deeply poor in 2012 have grown, and hundreds of millions of people have moved into more secure income bands over the longer run. But the World Bank's 2024 Poverty, Prosperity, and Planet report is a reminder that progress is uneven. Almost 700 million people were still living on less than $2.15 per day, and around 3.5 billion people were living on less than $6.85 per day.
That is why the simple arithmetic can feel both encouraging and frustrating. There is more than enough production in the world to make extreme poverty look unnecessary. But production is not the same as access, and wealth is not the same as a broadly productive economy.
Hidden wealth and tax avoidance are still part of the story
The 2012 article mentioned estimates of offshore or sheltered assets. In 2026, it is better to be careful with this subject. The old "$21 trillion to $32 trillion" estimates were useful as a warning about scale, but they should not be treated as a precise current tally. More recent work from the Tax Justice Network focuses heavily on tax losses and profit shifting. Its State of Tax Justice 2025 report says countries lost about $1.7 trillion to global corporate tax abuse over the six years for which data was available, and that public country-by-country reporting could have prevented an estimated $475 billion of that loss.
That matters because a society can be productive on paper while still failing to fund the things that make people more productive: education, health, infrastructure, courts, safety, and basic public capacity. When wealth is excellent at preserving itself but poor at circulating into opportunity, capitalism starts to look less like a system for growth and more like a system for defending position.
The question is still balance
The 2012 article ended by asking whether governments should help unproductive people become more productive, whether the wealthy can become too good at preserving wealth, and whether there are ways to bring balance while preserving capitalism. Those are still the right questions.
A crude worldwide redistribution is not a serious operating plan. But neither is pretending that the market automatically turns global production into decent lives. The more useful question is how to make productive work easier, tax avoidance harder, education and health more widely available, and ownership less concentrated without breaking the incentives that help create growth in the first place.
The world in 2026 is richer than it was in 2012. The frustrating part is that the moral problem did not disappear as the numbers got bigger. If anything, the larger numbers make the problem clearer: we have more capacity than before, but capacity only matters when it becomes real opportunity for people.
Sources and notes
Sources used for this 2026 update include World Bank global GDP, population, and poverty data, the IMF World Economic Outlook Data Mapper, the UBS Global Wealth Report 2025, and the Tax Justice Network State of Tax Justice 2025.